|
ast week, I argued that predictive modeling is not as intimidating as it sounds. In fact, you don't need a consultant to build your models and you are the best person to do it.
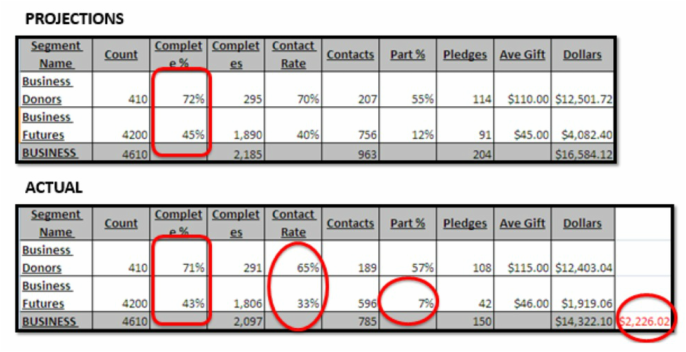
You are the best person to build your projections for a couple of reasons: 1) You do/should have the most knowledge about how your program has historically performed and your strategies going forward. 2) You will be the person working with those projections throughout the fundraising year as living documents to guide your path to optimum performance. To work best with the predictive model, you should build it and understand it from the ground up. A great report (if you can easily get it) is a projections versus actual report that shows you segment-by-segment, side-by-side, where you thought you would be and where you are currently. But if you can't get a report like this designed, no worries. You can easily have your projections (your predictive model) in one hand and your up-to-date actual results in another. You should do a P v. A (Projections versus Actual) analysis at least quarterly but ideally monthly. My recommendation would be to work up to more frequent analysis if you aren't currently doing it, as it can be overwhelming and time-consuming in the beginning. The benefits are abundant, though, as I will articulate. Here's how this works on the segment level: I'll use phonathon segments as an example, but this could be anything (direct mail, email, leadership giving, etc.) Say you are getting close to finished with the College of Business but it doesn’t look like you are going to reach your total dollars. You can now use your projections to pinpoint where the downturn occurred and proposed pointed solutions. (See charts above.) You notice that you are very close to finished (completion rate) and therefore you aren't going to have that many more calls in order to make up lost ground. The next thing that pops out to you is that contact rate didn't perform to expectations. This signals one major thing: lack of data integrity. Lastly, the participation rate for this group is much lower than projected. You have isolated the two major issues with the College of Business results thus far. If you never had the projections, your report to the Dean of the College of Business would probably simply be, "I'm sorry but we are going to fall short this year." Or worse, you might feel the need to follow that up with a bunch of speculations and excuses. Instead, you are armed with information and can break bad news with prepared data-driven solutions. So, a conversation with the Dean of the College of Business might go like this: “It appears that we may fall about $2,000 short of our goal for your college. This is due in part to our contact rate being lower than expected for the college overall and a slightly lower participation rate than we hoped for in the future donors. So, I would recommend that we send out a 'where are you?' email to try and get updated phone numbers for all of your graduates and we may lower the ask amounts for the future donors to help improve acquisition for this group.” This works the same way with your higher-ups. You will be able to show which metrics and schools are under-performing and explain the statistics rather than provide anecdotes or excuses. It works the exact same way if your results are amazing! You are able to report on where and how you beat the goal and therefore where the areas of opportunity are for the future. This perspective can change the course of your career because you will become the most trusted person in your organization. You are informed, realistic, and have solutions and analysis galore! Try this with your next project. Let me know how it goes. Comments are closed.
|
Jessica Cloud, CFREI've been called the Tasmanian Devil of fundraising and I'm here to talk shop with you. Archives
June 2024
Categories
All
|


 RSS Feed
